Asset & debt overview
All debt information provided is as at 31 December 2025, on a 100% interest basis and reflects facility limits unless stated otherwise.
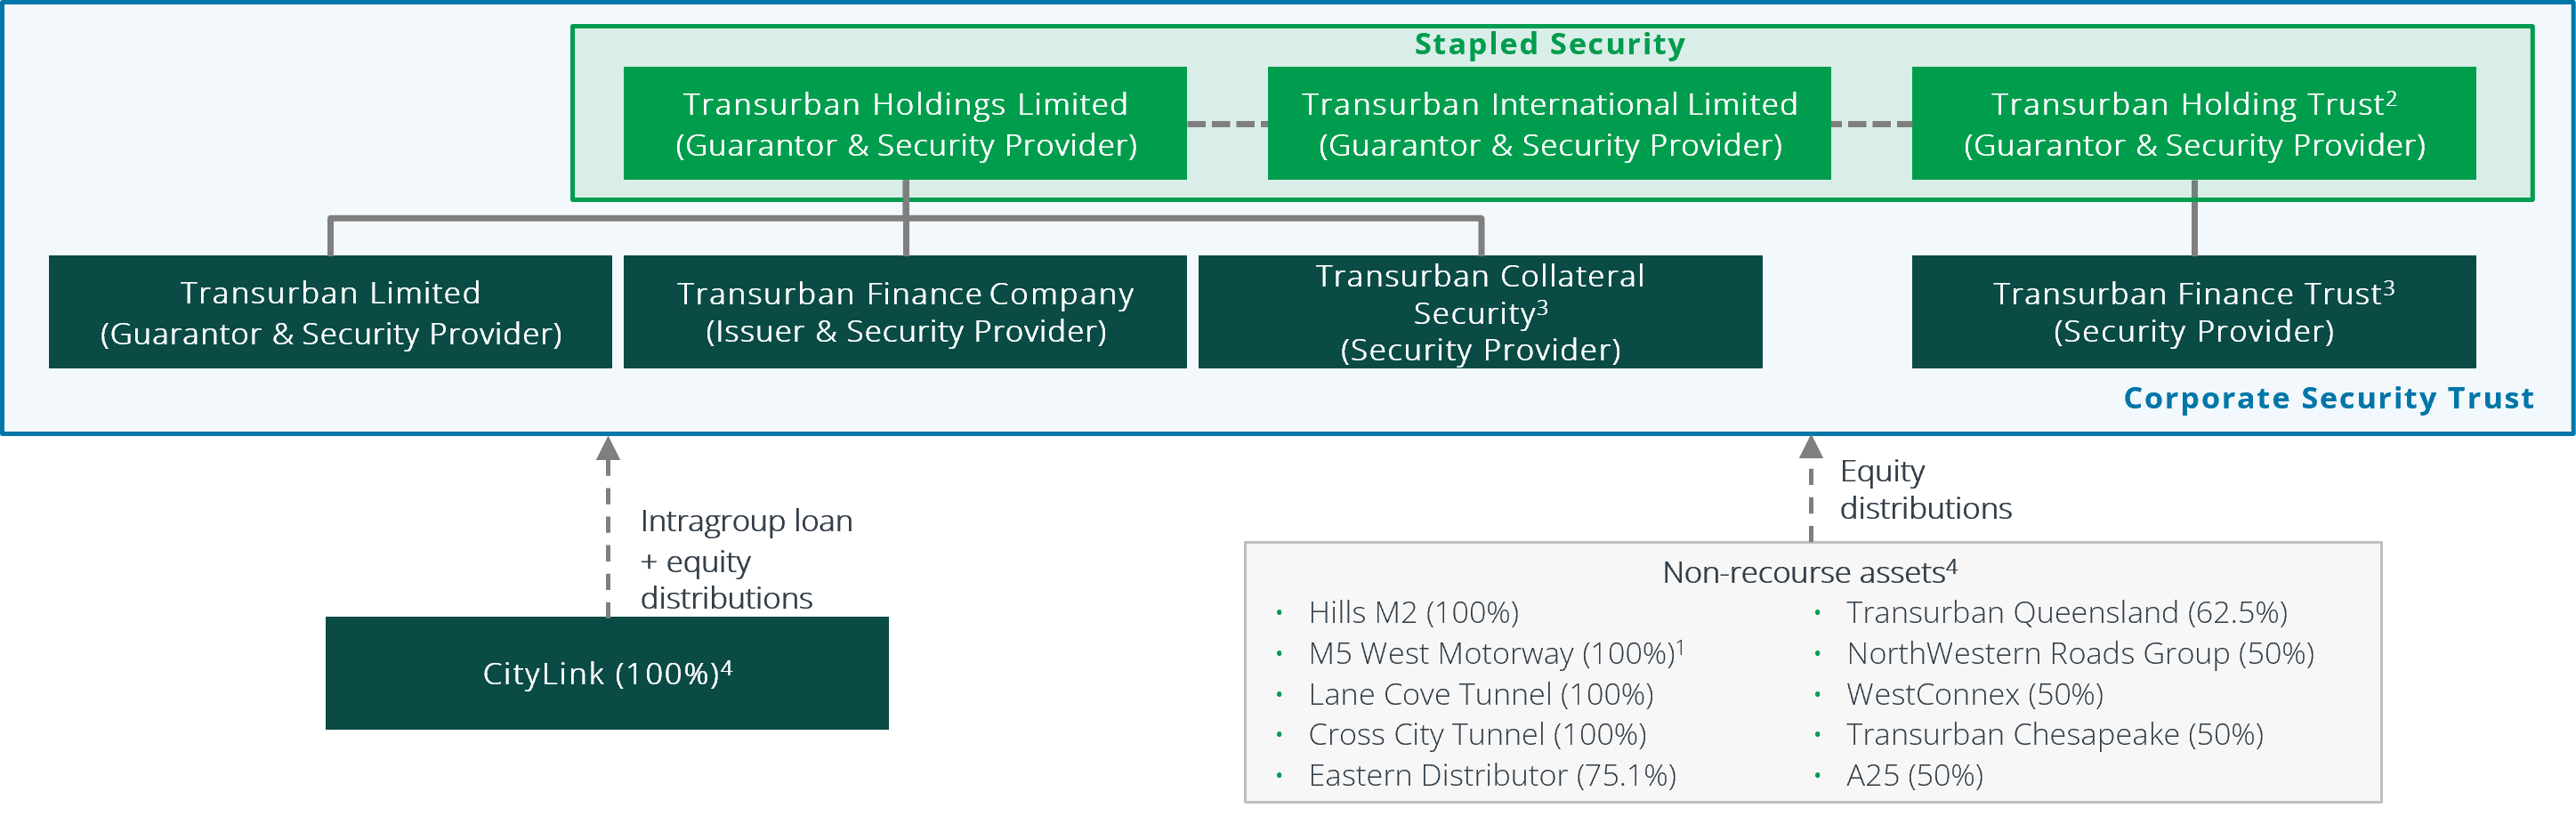
Corporate Debt Structure
- Transurban Finance Company Pty Ltd is a special purpose financing vehicle used to raise corporate debt on behalf of the Transurban Group
- Corporate debt is secured by a first ranking charge over the assets of the corporate security providers (“Security Providers” in the below diagram)
- Corporate debt also benefits from indirect security over CityLink and Transurban Group’s share of distributions generated by its other assets
- All senior secured lenders/noteholders rank pari passu
- All assets of the Transurban Group other than CityLink are funded by non-recourse project finance debt facilities1
1. M5 West Motorway’s non-recourse debt was repaid in FY25.
2. Transurban Infrastructure Management Limited Is the responsible entity and trustee of Transurban Holding Trust.
3. Transurban Collateral Security Pty Limited is the trustee of Transurban Finance Trust.
4. Percentages represent Transurban’s ownership interest as at 31 December 2025.
Corporate Debt
Bank Debt
Working Capital Facilities1
| Facility | Facility Limit | Drawn Amount | Maturity |
|---|---|---|---|
| Facility 1 | A$825M | - | Apr-2027 |
| Facility 2 | A$1,000M | - | Jun-2028 |
| Facility 3 | A$825M | - | Jun-2029 |
Letters of Credit
| Facility | Facility Limit | Issued Amount | Maturity |
|---|---|---|---|
| Facility 1 | US$30M | US$30M | Jun-2026 |
| Facility 2 | US$150M | A$173M | Jul-2027 |
| Facility 3 | A$40M | A$24M | May-2028 |
| Facility 4 | A$40M | US$10M | May-2028 |
| Facility 5 | A$40M | A$22M | May-2028 |
| Facility 6 | A$6M | A$5M | Dec-2028 |
1. Corporate Working Capital Facilities totalling $2,650m are syndicated facilities and can be drawn in AUD and/or USD.
Debt Capital Markets
EMTN
| Issuance | Amount | Coupon | Maturity | ISIN |
|---|---|---|---|---|
| Euro Bond 1 | €241M | 1.75% | Mar-2028 | XS1681520786 |
| Euro Bond 2 | €600M | 1.45% | May-2029 | XS1997077364 |
| Euro Bond 3 | €600M | 3.00% | Apr-2030 | XS2152883406 |
| Euro Bond 4 | €500M | 3.71% | Mar-2032 | XS2778764006 |
| Euro Bond 5 | €650M | 4.23% | Apr-2033 | XS2614623978 |
| Euro Bond 6 | €350M | 1.70% | Jul-2034 | XS2021470898 |
| Euro Bond 7 | €650M | 4.14% | Apr-2035 | XS3047435659 |
| Euro Bond 8 | €500M | 3.97% | Mar-2036 | XS2778764188 |
| Euro Bond 9 | €500M | 4.03% | Nov-2037 | XS3235974568 |
| NOK Bond | NOK750M | 3.00% | Jul-2027 | XS1449824108 |
| Maple Bond | CAD$650M | 4.56% | Nov-2028 | CA89400PAJ27 |
| GBP Bond | GBP300M | 6.61% | Apr-2040 | XS3047435733 |
144A
| Issuance | Amount | Coupon | Maturity | ISIN |
|---|---|---|---|---|
| 144A | US$432M | 3.38% | Mar-2027 | US89400PAG81 |
| 144A | US$900M | 2.45% | Mar-2031 | USQ9194UBC55 |
| 144A | US$550M | 4.92% | Mar-2036 | US89400PAL76 |
Asset Debt
CityLink
Asset Overview
| Network | Melbourne, Victoria |
|---|---|
| Transurban Ownership Interest | 100.0% |
| HY26 Toll Revenue | A$526M |
| HY26 EBITDA1 | A$462M |
| Credit Rating / Outlook | N/A |
Debt Summary
Not applicable as CityLink is not funded by non-recourse project finance debt facilities. Refer to the Corporate Debt Structure above for further details.
1. Includes corporate entity results.
West Gate Tunnel
Asset Overview
| Network | Melbourne, Victoria |
|---|---|
| Transurban Ownership Interest | 100.0% |
| HY26 Toll Revenue | A$5M |
| HY26 EBITDA | A$3M |
| Credit Rating / Outlook | N/A |
Debt Summary
Not applicable as WGT is not funded by non-recourse project finance debt facilities. Refer to the Corporate Debt Structure above for further details.
Hills M2
Asset Overview
| Network | Sydney, New South Wales |
|---|---|
| Transurban Ownership Interest | 100.0% |
| HY26 Toll Revenue | A$201M |
| HY26 EBITDA | A$165M |
| Credit Rating / Outlook1 | Moody's – A2 / Stable |
Institutional Term Loan Summary
| Facility Limit | Maturity | |
|---|---|---|
| Facility 1 | A$475M | Apr-2030 |
| Facility 2 | A$340M | Jan-2030 – Apr-2035 |
1. These credit ratings are provided for use by wholesale investors only and must not be used, and the Transurban Group does not intend or authorise their use, in the support of or in relation to the marketing of financial products to retail investors in Australia.
Cross City Tunnel
Asset Overview
| Network | Sydney, New South Wales |
|---|---|
| Transurban Ownership Interest | 100.0% |
| HY26 Toll Revenue | A$41M |
| HY26 EBITDA | A$29M |
| Credit Rating / Outlook | N/A |
Bank Debt Summary
| Facility Limit | Maturity | |
|---|---|---|
| Facility 1 | A$260M | Mar-2026 – Dec-2027 |
Lane Cove Tunnel
Asset Overview
| Network | Sydney, New South Wales |
|---|---|
| Transurban Ownership Interest | 100.0% |
| HY26 Toll Revenue | A$51M |
| HY26 EBITDA | A$31M |
| Credit Rating / Outlook | N/A |
Debt Summary
| Facility Limit | Maturity | |
|---|---|---|
| Private Placement 1 | A$40M | May-2028 |
| Private Placement 2 | A$40M | May-2031 |
| Facility 1 | A$162M | Dec-2031 |
M1 Eastern Distributor
Asset Overview
| Network | Sydney, New South Wales |
|---|---|
| Transurban Ownership Interest | 75.1% |
| HY26 Toll Revenue1 | A$81M |
| HY26 EBITDA1 | A$62M |
| Credit Rating / Outlook | N/A |
Bank Debt Summary
| Facility Limit | Maturity | |
|---|---|---|
| Facility 1 | A$238M | Mar-2026 – Dec-2030 |
1. 100% interest basis.
NorthWestern Roads Group
Asset Overview
| Network | Sydney, New South Wales |
|---|---|
| Transurban Ownership Interest | 50.0% |
| HY26 Toll Revenue1,2 | A$344M |
| HY26 EBITDA1,2 | A$269M |
| Credit Rating / Outlook3 | Moody's – A3 / Stable Fitch – A- / Stable |
Bank Debt Summary
| Facility Limit | Maturity | |
|---|---|---|
| Facility 1 | A$203M | Jun-2027 |
| Facility 2 | A$624M | Feb-2028/Feb-2029 |
| Facility 3 | A$205M | May-2036 |
Institutional Term Loan Summary
| Facility Limit | Maturity | |
|---|---|---|
| Facility 1 | A$405M | Nov-2031/Nov-2032 |
Letters of Credit
| Facility Limit | Issued Amount | Maturity | |
|---|---|---|---|
| Facility 1 | A$15M | A$14M | Feb-2027 |
Debt Capital Markets Summary
| Issuance | Amount | Coupon | Maturity | ISIN |
|---|---|---|---|---|
| A$MTN 1 | A$100M | BBSW3M + 2.00% | Jul-2026 | AU3FN0031563 |
| A$MTN 2 | A$435M | 4.50% | Mar-2027 | AU3CB0243566 |
| A$MTN 3 | A$100M | 4.50% | Sep-2027 | AU3CB0243590 |
| A$MTN 4 | A$155M | 2.70% | Jun-2030 | AU3CB0272920 |
| USPP 2017 A | A$100M | 4.47% | Aug-2029 | N/A |
| USPP 2017 B | A$100M | 4.65% | Aug-2032 | N/A |
| USPP 2018 C | A$345M | 4.46% | Dec-2030 | N/A |
| USPP 2018 D | A$195M | 4.65% | Dec-2033 | N/A |
| USPP 2018 E | A$75M | 4.80% | Dec-2038 | N/A |
1. 100% interest basis.
2. Includes corporate entity results.
3. These credit ratings are provided for use by wholesale investors only and must not be used, and the Transurban Group does not intend or authorise their use, in the support of or in relation to the marketing of financial products to retail investors in Australia.
M5 Motorway
Asset Overview
| Network | Sydney, New South Wales |
|---|---|
| Transurban Ownership Interest | 100.0% |
| HY26 Toll Revenue | A$186M |
| HY26 EBITDA | A$155M |
| Credit Rating / Outlook | N/A |
Bank Debt Summary
No remaining debt at M5. The final remaining quarterly amortisation payment was made in June 2025.
WestConnex
Asset Overview
| Network | Sydney, New South Wales |
|---|---|
| Transurban Ownership Interest | 50.0% |
| HY26 Toll Revenue1,2 | A$505M |
| HY26 EBITDA1,2 | A$405M |
| Credit Rating / Outlook3 | S&P - BBB+ / Stable |
Bank Debt Summary
| Facility Limit | Maturity | |
|---|---|---|
| Facility 1 | A$900M | Aug-2026 |
| Facility 2 | A$1,205M | Mar-2027 |
| Facility 3 | A$800M | Dec-2027 |
| Facility 4 | A$300M | May-2028 |
| Facility 5 | A$800M | Aug-2029 |
| Facility 6 | A$200M | May-2035 |
Institutional Term Loan Summary
| Facility Limit | Maturity | |
|---|---|---|
| Facility 1 | A$725M | Dec-2032 |
Government Debt Summary
| Facility Limit | Maturity | |
|---|---|---|
| WCX M5 Government Debt | A$2,694M | Jul-2034 |
Debt Capital Markets Summary
| Issuance | Amount | Coupon | Maturity | ISIN |
|---|---|---|---|---|
| A$MTN 1 | AUD650M | 3.15% | Mar-2031 | AU3CB0279057 |
| A$MTN 2 | AUD550M | 6.15% | Oct-2030 | AU3CB0303188 |
| USPP 2021 A | USD350M | 2.98% | Sep-2031 | N/A |
| USPP 2021 B | USD350M | 3.08% | Jun-2033 | N/A |
| USPP 2021 C | USD400M | 3.28% | Jun-2036 | N/A |
| USPP 2021 D | AUD350M | 4.48% | Jun-2041 | N/A |
| USPP 2023 E | USD369M | 6.49% | Dec-2033 | N/A |
| USPP 2023 F | CAD200M | 5.89% | Dec-2033 | N/A |
Letters of Credit
| Facility Limit | Issued Amount | Maturity | |
|---|---|---|---|
| Facility 1 | A$220M | A$190M | Aug-2027 |
1. 100% interest basis.
2. Includes corporate entity results.
3. These credit ratings are provided for use by wholesale investors only and must not be used, and the Transurban Group does not intend or authorise their use, in the support of or in relation to the marketing of financial products to retail investors in Australia.
Transurban Queensland
Asset Overview
| Network | Brisbane, Queensland |
|---|---|
| Transurban Ownership Interest | 62.5% |
| HY26 Toll Revenue1,2,3 | A$518M |
| HY26 EBITDA1,2,3 | A$486M |
| Credit Rating / Outlook4 | S&P – BBB / Stable |
Debt Summary
| Facility Limit | Maturity | |
|---|---|---|
| Bank Debt Facility 1 | A$40M | Jul-2028 |
| Bank Debt Facility 2 | A$340M | Jul-2028 |
| Private Placement | A$200M | Apr-2030 |
Institutional Term Loan Summary
| Facility Limit | Maturity | |
|---|---|---|
| ITL Facility 1 | A$500M | Jun-2033/Jun-2035 |
| ITL Facility 2 | A$220M | Oct-2033/Oct-2035 |
| ITL Facility 3 | A$485M | Sep-2035 |
Debt Capital Markets Summary
| Amount | Coupon | Maturity | ISIN | |
|---|---|---|---|---|
| A$MTN 1 | A$250M | 6.35% | May-2030 | AU3CB0303964 |
| A$MTN 2 | A$300M | 3.25% | Aug-2031 | AU3CB0279958 |
| A$MTN 3 | A$250M | 5.62% | Aug-2034 | AU3CB0312833 |
| A$MTN 4 | A$255M | 5.29% | Sep-2032 | AU3CB0322196 |
| CHF Bond A3 | CHF175M | 0.65% | Nov-2026 | CH0340912168 |
| CHF Bond B3 | CHF190M | 0.88% | Nov-2031 | CH1108704839 |
| CHF Bond C | CHF120M | 1.43% | Aug-2033 | CH1433241184 |
| USPP 2015 A | US$230M | 4.26% | Sep-2027 | N/A |
| USPP 2015 B | US$256M | 4.41% | Sep-2030 | N/A |
| USPP 2015 C | A$70M | 5.78% | Sep-2030 | N/A |
| USPP 2016 D | US$130M | 3.45% | Dec-2026 | N/A |
| USPP 2016 E | US$225M | 3.55% | Dec-2028 | N/A |
| USPP 2016 F | US$78M | 3.70% | Dec-2031 | N/A |
| USPP 2016 G | A$35M | 4.64% | Dec-2026 | N/A |
| USPP 2016 H | A$75M | 5.00% | Dec-2031 | N/A |
| USPP 2016 I | A$100M | 5.17% | Jan-2035 | N/A |
| USPP 2019 J | US$144M | 3.96% | May-2029 | N/A |
| USPP 2019 K | US$245M | 4.06% | May-2031 | N/A |
| USPP 2019 L | US$180M | 4.16% | May-2034 | N/A |
| USPP 2019 M | A$30M | 3.94% | May-2029 | N/A |
| USPP 2019 N | A$40M | BBSW3M + 2.15% | May-2034 | N/A |
| Regulation S | US$500M | 4.50% | Apr-2028 | XS1808838434 |
1. 100% interest basis.
2. Includes corporate entity results.
3. EBTIDA includes non-recurring items. In HY26 this includes commercial payments receivable from third parties in connection with the Group’s construction contracts recognised during the current reporting period of $75m.
4. These credit ratings are provided for use by wholesale investors only and must not be used, and the Transurban Group does not intend or authorise their use, in the support of or in relation to the marketing of financial products to retail investors in Australia.
5. Transurban Queensland Group's disclosures and financial statements can be accessed here.
Transurban Chesapeake
Overview
Transurban Chesapeake owns 100% of the entities that developed, built, financed and now operate and maintain the 95 Express Lanes, 395 Express Lanes and 495 Express Lanes. Transurban has a 50% interest in Transurban Chesapeake.
Bank Debt Summary
| Facility Limit | Maturity | |
|---|---|---|
| Facility 1 | US$250M | Mar-2028 |
495 Express Lanes
Asset Overview
| Network | Greater Washington Area |
|---|---|
| Transurban Ownership Interest | 50.0% |
| HY26 Toll Revenue1,2 | A$94M |
| HY26 EBITDA1,2 | A$64M |
| Credit Rating / Outlook3 | Moody’s – Baa1 / Stable Kroll – BBB+ / Stable |
Debt Capital Markets Summary
| Amount | Maturity | |
|---|---|---|
| Private Activity Bond 1 | US$54M | Dec-20424 |
| Private Activity Bond 2 | US$133M | Dec-20474 |
| Private Activity Bond 3 | US$49M | Dec-20524 |
| Private Activity Bond 4 | US$63M | Dec-20574 |
Government Debt Summary
| Amount | Maturity | |
|---|---|---|
| TIFIA 1 | US$840M | Oct-20474 |
| TIFIA 2 | US$212M | Jun-2060 |
| VTIB | US$49M | Jun-2060 |
1. 100% interest basis.
2. Income and expenses are translated at average exchange rates.
3. These credit ratings are provided for use by wholesale investors only and must not be used, and the Transurban Group does not intend or authorise their use, in the support of or in relation to the marketing of financial products to retail investors in Australia.
4. Final maturity.
95 Express Lanes
Asset Overview
| Network | Greater Washington Area |
|---|---|
| Transurban Ownership Interest | 50.0% |
| HY26 Toll Revenue1,2 | A$193M |
| HY26 EBITDA1,2 | A$144M |
| Credit Rating / Outlook3 | S&P – Senior: BBB / Stable S&P – TIFIA: BBB / Stable Fitch – Senior: BBB / Stable Fitch – TIFIA: BBB / Stable |
Debt Capital Markets Summary
| Amount | Maturity | |
|---|---|---|
| Private Activity Bond 1 | US$177M | Jan-20484 |
| Private Activity Bond 2 | US$204M | Jan-20404 |
| Private Activity Bond 3 | US$196M | Jan-20404 |
| Private Activity Bond 4 | US$62M | Jan-20424 |
Government Debt Summary
| Amount | Maturity | |
|---|---|---|
| TIFIA | US$294M | Jul-20474 |
| VTIB | US$46M | Dec-2047 |
1. 100% interest basis.
2. Income and expenses are translated at average exchange rates.
3. These credit ratings are provided for use by wholesale investors only and must not be used, and the Transurban Group does not intend or authorise their use, in the support of or in relation to the marketing of financial products to retail investors in Australia.
4. Final maturity.
A25
Asset Overview
| Network | North America Area |
|---|---|
| Transurban Ownership Interest | 50.0% |
| HY26 Toll Revenue1,2 | A$45M |
| HY26 EBITDA1,2 | A$39M |
| Credit Rating / Outlook | N/A |
Bank Debt Summary
| Facility Limit | Maturity | |
|---|---|---|
| Facility 1 | CAD$348M | Jan-20273 |
Letters of Credit
| Facility Limit | Issued Amount | Maturity | |
|---|---|---|---|
| Facility 1 | CAD$15M | CAD$12M | Jan-2027 |
1. 100% interest basis.
2. Income and expenses are translated at average exchange rates.
3. Final maturity.