Summary
Key Debt Metrics
| 30 June 2025 | |||
|---|---|---|---|
| Transurban Group | Corporate | Non- recourse | |
| Weighted average maturity (years)1,2 | 6.6 yrs | 6.1 yrs | 7.0 yrs3 |
| Weighted average cost of AUD debt1 | 4.5% | 4.9% | 4.2% |
| Weighted average cost of USD debt1 | 3.7% | 4.1% | 3.6% |
| Weighted average cost of CAD debt1 | 4.9% | 4.6% | 6.3% |
| Hedged1,2,4 | 92.5% | 84.8% | 98.7% |
| Gearing (proportional debt to enterprise value)1,2,5 | 37.8% | ||
| FFO/Debt (S&P)7 | 10.5% | ||
| Corporate senior interest cover ratio (historical ratio for 12 months) | 3.7x | ||
| Corporate debt rating (S&P / Moody's / Fitch) | BBB+ / Baa1 / A- | ||
| 30 June 2024 | |||
|---|---|---|---|
| Transurban Group | Corporate | Non- recourse | |
| Weighted average maturity (years)1,2 | 6.7 yrs | 5.4 yrs | 7.8 yrs3 |
| Weighted average cost of AUD debt1 | 4.5% | 4.8% | 4.3% |
| Weighted average cost of USD debt1 | 3.6% | 4.1% | 3.3% |
| Weighted average cost of CAD debt1 | 4.9% | 4.6% | 6.3% |
| Hedged1,2,4 | 88.2% | 85.5% | 90.4% |
| Gearing (proportional debt to enterprise value)1,2,5 | 39.9% | ||
| FFO/Debt (S&P) | 11.5% | ||
| Corporate senior interest cover ratio (historical ratio for 12 months) | 4.2x | ||
| Corporate debt rating (S&P / Moody's / Fitch) | BBB+ / Baa1 / A- | ||
1. Calculated using proportional drawn debt exclusive of letters of credit. Calculated in effective currency after hedging. Non-AUD denominated debt converted at the hedged rate where cross currency swaps are in place.
2. Calculated in effective currency after hedging. Non-AUD denominated debt converted at the rates contained in Appendix A.
3. The weighted average maturity of Australian non-recourse debt is 6.2 years as at 30 June 2024 and 5.5 years as at 30 June 2025.
4. Hedged percentage comprises fixed rate debt and hedged floating rate debt (inclusive of forward starting swaps) and is a weighted average of total proportional drawn debt, exclusive of issued letters of credit.
5. Calculated using proportional debt to enterprise value, exclusive of issued letters of credit. Security price was $12.40 as at 30 June 2024 and $13.98 as at 30 June 2025 with 3,092 million securities on issue as at 30 June 2024 and 3,108 million securities on issue as at 30 June 2025.
Debt Position Summary
As at 30 June 2025
| CORPORATE1 | |
|---|---|
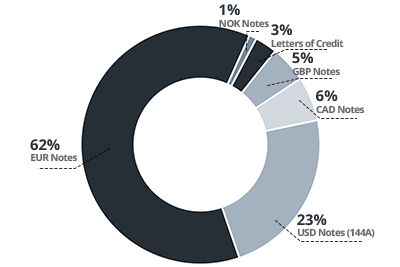 | |
| Total debt2 | A$12.1B |
| Average tenor3 | 6.1 years |
| Average AUD interest rate4 | 4.9% |
| Average USD interest rate4 | 4.1% |
| Average CAD interest rate4 | 4.6% |
| AUSTRALIA NON-RECOURSE1 | |
|---|---|
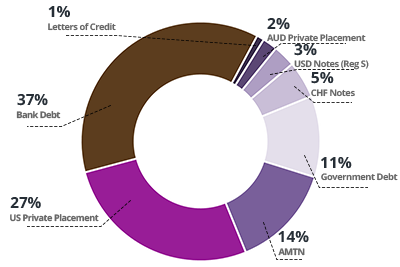 | |
| Total debt2 | A$22.0B |
| Average tenor3 | 5.5 years |
| Average AUD interest rate4 | 4.2% |
| Average USD interest rate4 | N/A |
| Average CAD interest rate4 | N/A |
| NORTH AMERICA NON-RECOURSE1 | |
|---|---|
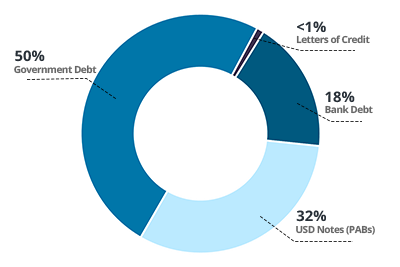 | |
| Total debt2 | A$4.4B |
| Average tenor3 | 15.5 years |
| Average AUD interest rate4 | N/A |
| Average USD interest rate4 | 3.6% |
| Average CAD interest rate4 | 6.3% |
1. Non-AUD denominated debt converted at the rates contained in Appendix A.
2. Represents drawn amounts on a 100% interest basis, including separate letters of credit issued.
3. Calculated using proportional drawn debt.
4. Proportional drawn debt exclusive of issued letters of credit.
Debt Maturity Profile
Corporate (as at 30 June 2025)1,2
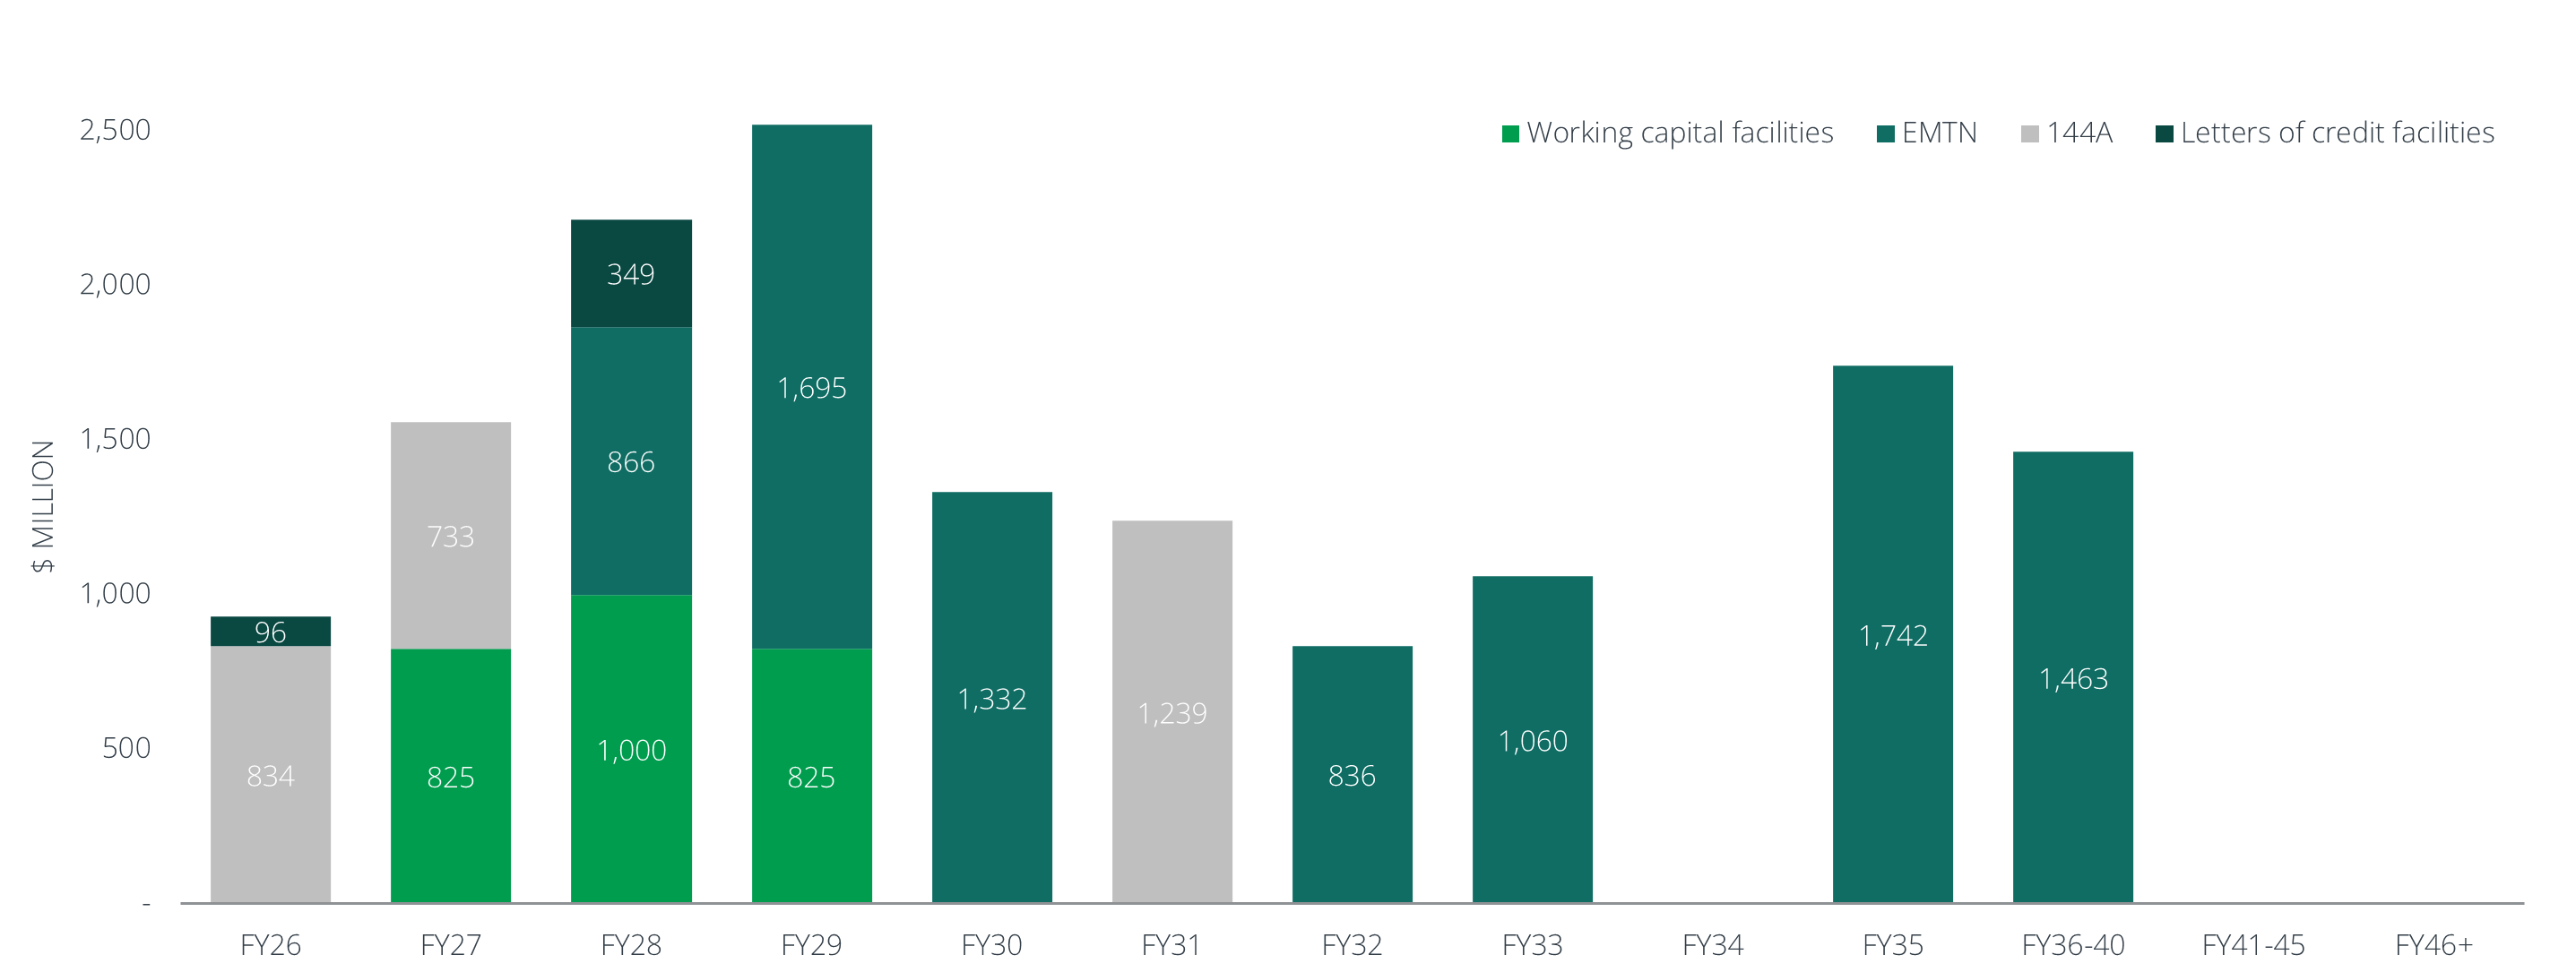
1. The full value of debt facilities is shown. Debt is shown in the financial year in which it matures.
2. Debt values are shown in AUD as at 30 June 2025. Non-AUD denominated debt converted at the rates contained in Appendix A.
Non-Recourse (as at 30 June 2025)1,2
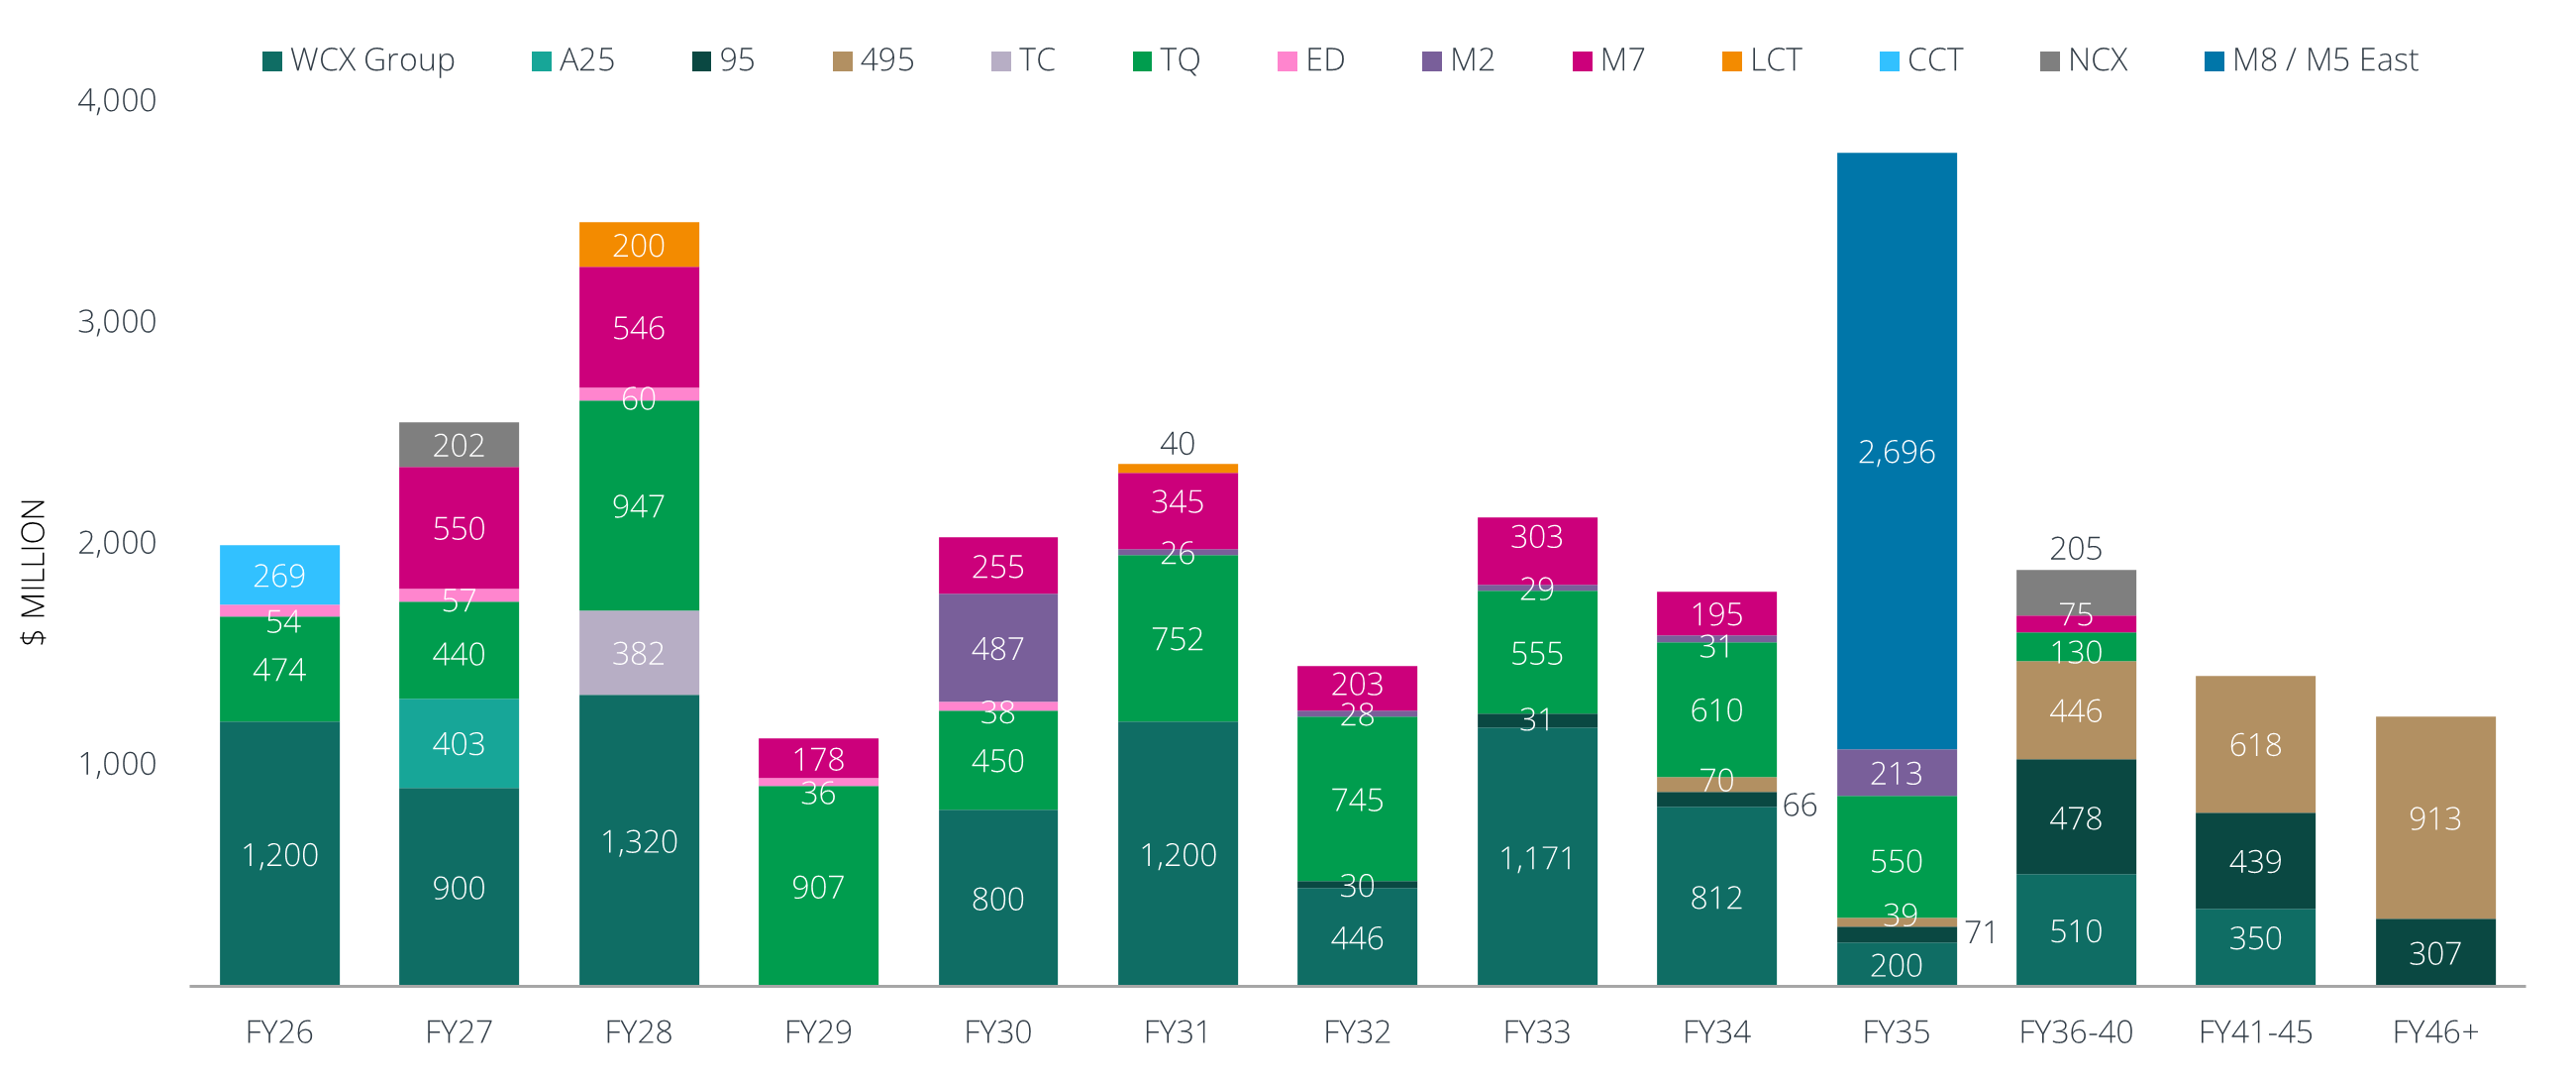
1. The full value of debt facilities is shown, not Transurban’s share, as this is the value of debt for refinancing purposes. Debt is shown in the financial year in which it matures. Annual maturities or amortisation repayments less than A$25m are not shown for graph purposes.
2. Debt values are shown in AUD as at 30 June 2025. Non-AUD denominated debt converted at the rates contained in Appendix A.
Appendix A: FX rate table
Non-AUD denominated debt converted at the applicable rates:
| No cross currency swaps | Cross currency swaps in place | ||
|---|---|---|---|
| USD | CAD | USD CAD CHF EUR NOK GBP | |
| FY25 | 0.6545 | 0.8938 | Hedged rate |
| FY24 | 0.6630 | 0.9093 | |
