Transurban insights: Explore our data
On average more than 2.5 million trips are made on our roads every day. We use the information collected from these trips to improve road safety and travel efficiency.
If you’ve landed here looking for the sustainability reporting data pack, please visit our investor centre.
Note: Our now-decommissioned insights microsite (insights.transurban.com) automatically redirects visitors to this page. If you went to that microsite to find some specific data, please contact us and we will send this data to you directly.
Reports
On average more than 2.5 million trips are made on our roads every day. We use the information collected from these trips to improve road safety and travel efficiency.
If you’ve landed here looking for the sustainability reporting data pack, please visit our investor centre.
Urban mobility trends reports
Our Urban Mobility Trends reports track people’s transport habits and preferences, as well as related factors such as their concern about congestion and transport costs – allowing us to observe mobility trends over time.
Insights reports
Transurban Insights reports showcase findings on issues relevant to road transport. Research findings are drawn from our own data, from research conducted by our business, and from commissioned surveys.
2023
Road safety
Safety
Transurban’s Australian roads have been found to be, on average, at least twice as safe as like roads by the Monash University Accident Research Centre.
We achieve our high safety performance by monitoring the roads 24/7 and controlling conditions such as speed limits and lane closure through state-of-the-art technology.
When there is a crash, we detect it within seconds and one of our Incident Response teams can be there within minutes to help.
Crash data
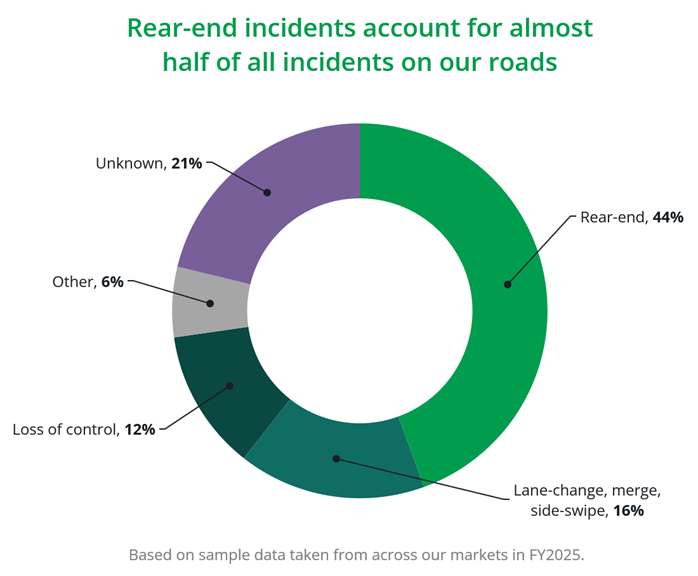
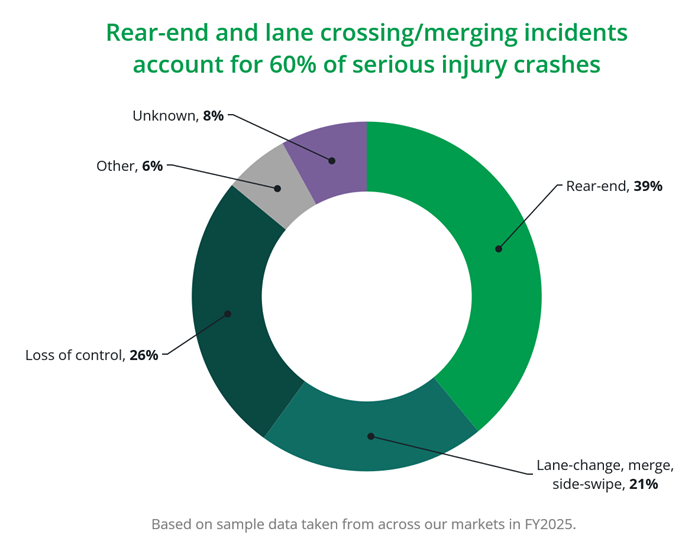
The most common types of crashes we see on our roads are rear-enders and out-of-control vehicles. Rear-enders are more likely to occur during peak periods whereas the proportion of out-of-control crashes doubles when it’s raining.
Other incidents together account for slightly less than 30% of total incidents. Other incidents include objects hitting or being hit by vehicles; and falls inside or from vehicles.
iRAP ratings of our roads
The International Road Assessment Program (iRAP) has rated 100% of our road networks in Australia and USA as three-star or above:
- In Australia, 92% of our network is rated four-star and above, with NorthConnex rated at five-star.
- In USA, 63% of Express Lanes is rated at four-star and above.
The iRAP ratings of all our roads is available on a dashboard published by Austroads.
Australia’s National Road Safety Strategy has a target of three-star or better or 80% of national highways and high-speed roads.
Improving road safety
Our roads are among the most sophisticated in the world. The thousands of pieces of innovative technology used on our roads together create a ‘managed motorway’ system and help keep our roads free-flowing.
When an incident does occur, it is quickly identified and responded to by our traffic control room operators and incident response teams.
We use data collected by roadside technology, along with third-party data, to inform maintenance works and to identify opportunities to upgrade our roads and improve safety.
Our road safety page has more information about tunnel safety, our traffic control rooms, and our incident response.
Case study: Data-driven improvement
We analyse our data, and third-party data, to identify opportunities for improving the safety of our roads.
For example, we noticed a pattern of rear-end crashes occurring just before the citybound Punt Road and Batman Avenue exit on CityLink in Melbourne. By analysing CCTV footage of crashes in the area we determined these crashes were likely the result of sudden or late lane changing by motorists that was forcing vehicles behind to slow down or brake suddenly.
In 2021 we installed new, earlier signage and lane markers on the road. This gave drivers advanced warning to exit and more time to choose their preferred lane. The result was a 75% reduction in rear-end crashes and a 66% reduction in lane side swipes despite higher traffic volumes.
Safer driving
Road-user awareness, perceptions and behaviours are key factors we consider in developing safety solutions for our roads.
Our road safety insight reports (at the top of the page) collate the research we have conducted with road users to help develop more effective interventions.
Toll road use frequency
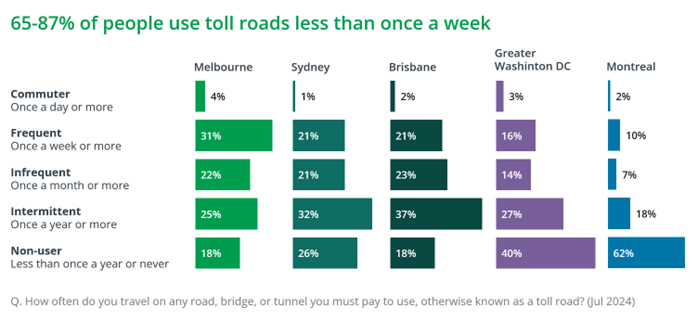
We asked people in Melbourne, Sydney, Brisbane, the Greater Washington Area, and Montreal how regularly they use toll roads. We found most people use toll roads occasionally, and in most cases, less than once a week.
Find out about the cost of tolls
Linkt is Transurban's retail brand in Australia. You can calculate the cost of a tolled trip using one of our Toll Calculators:
Linkt Assist
If you or someone you know is facing hardship and having difficulty managing toll payments, please get in contact with Linkt Assist, our dedicated hardship response team.
Travel patterns and preference
We surveyed people on how they choose to move around their city, and what influences their choices, as part of our Urban Mobility Trends report series (at the top of the page).
Reasons for using toll roads
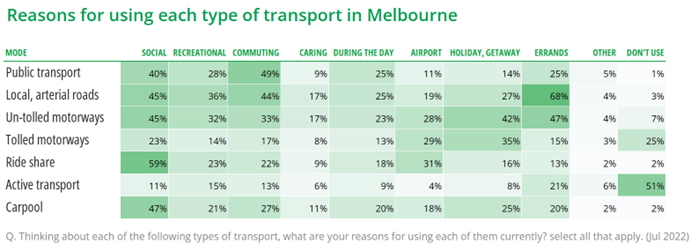
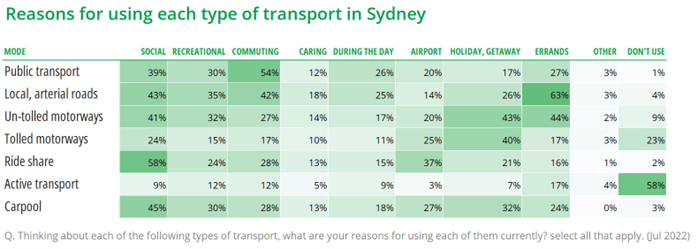
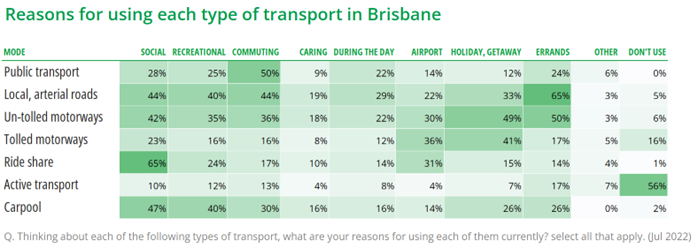
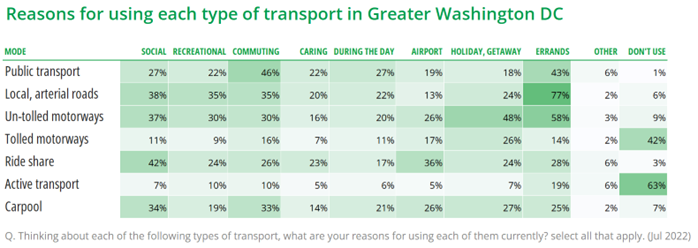
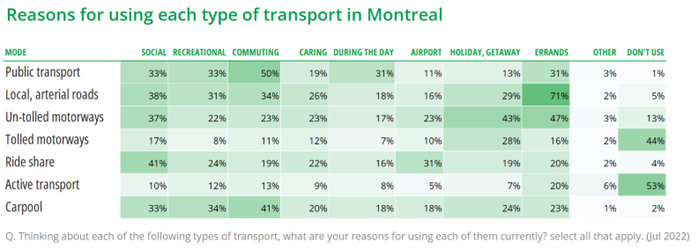
We asked people what mode of transport they use to make different trip types and found:
- public transport is the most common mode of transport for commuting
- people are more likely to choose ride share services or carpool when heading to social events
- local and arterial roads are relied on by people to run errands
- the most common reason for using toll roads or Express Lanes is to go on a getaway, or when travelling to or from the airport.
Reasons for using each type of transport in:
Mode choice
People’s choices about which mode of transport they regularly use have stabilised since the pandemic lockdowns of 2020-21.
Read our Urban Mobility Trends reports (at the top of this page) for information about:
- how people commute to work,
- the number of days per week they work from their workplace, and
- what influences their travel choices.
Sustainability
We believe a strong transport network is one made up of a good mix of rail, road and active transport to keep everyone moving.
At the same time we recognise that building and operating roads generates greenhouse gas emissions, which contribute to climate change.
We’re working hard to decarbonise our business and help the millions of customers who drive on our roads to reduce their impact.
Read our sustainability approach and download our ESG performance data.
Road funding
Most governments around the world collect fuel excise on every litre or gallon of petrol and diesel. Revenue from fuel excise contributes towards the construction and maintenance of roads. As vehicles become more fuel efficient and people transition to electric vehicles this revenue source will decline.
